Answered calls
Calls taken by an agent: how many waited, for how long, and what share fell under the threshold you set.
At a glance
| Where | Reports, Answered calls |
| What it shows | four counters, the wait-time breakdown, the service level, then the detail queue by queue |
| Filters | Queue, From, To, SLA (sec) |
| Threshold | from 1 to 600 seconds, 30 by default |
| If the period is empty | "No answered calls for this period" |
How it works
A call is counted as answered the moment the queue connects it to an agent. The wait time is the time spent in the queue before that connection. It doesn't include the ringing at the agent's end, which is counted separately and can be read in the call detail of the Distribution report.
The report then sorts these waits in two ways:
- Answered by wait time splits calls into seven fixed brackets: ≤15s, 16-30s, 31-45s, 46-60s, 61-90s, 91-120s and >120s. Each call falls into one bracket, and only one.
- Service level is cumulative: each row counts every call taken in under 5, 10, 15, 20, 30 then 60 seconds. The percentages therefore rise from row to row. These six thresholds are fixed and don't depend on the SLA (sec) field.
The SLA (sec) filter field only acts on two places: the SLA tile at the top of the page and the SLA column of the by-queue table.
What the screen shows
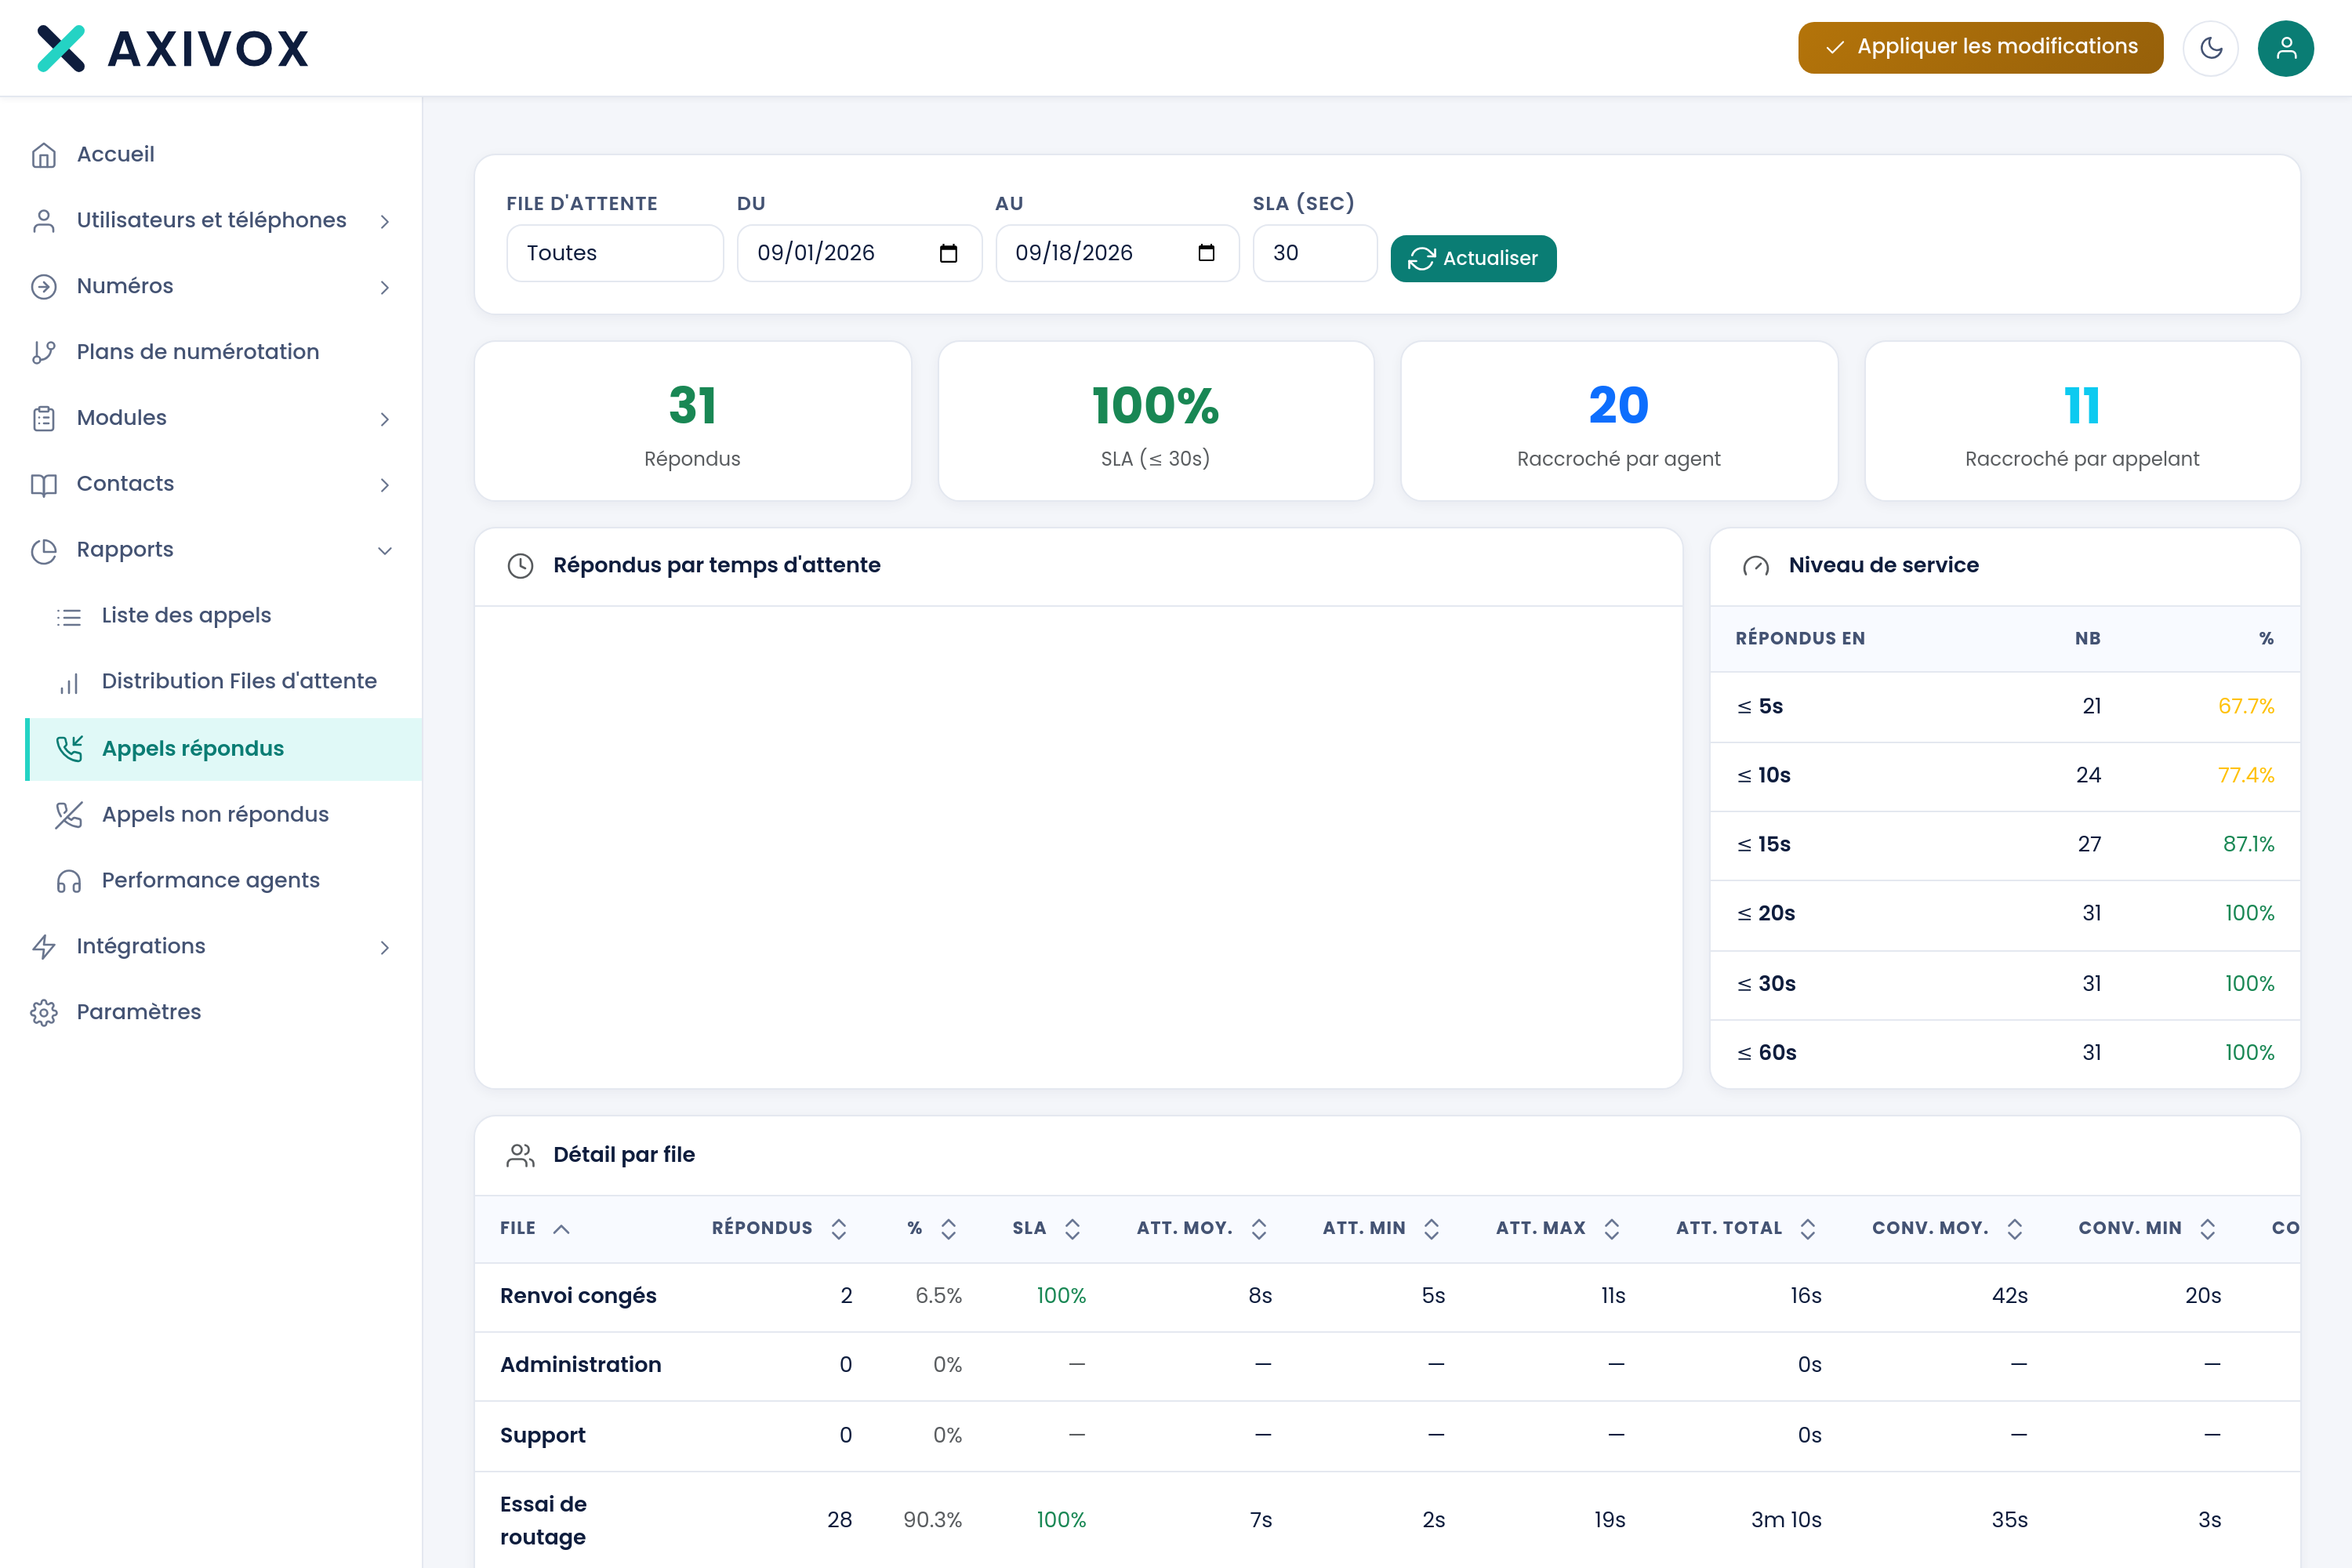
The four tiles at the top: Answered, SLA followed by the threshold you entered, Hung up by agent and Hung up by caller.
The Detail by queue table repeats everything, queue by queue:
| Column | What it shows |
|---|---|
| Queue | the queue's name |
| Answered, then % | the calls taken, and their share of the total across all queues |
| SLA | the share of answered calls taken under your threshold. A dash means no call was answered |
| Avg., min, max, total wait | the wait time before connection |
| Avg., min, max, total conv. | the conversation time |
| Transf. | the calls transferred out of the queue |
| By agent | the conversations the agent ended |
| By caller | the conversations the caller ended |
Each header can be clicked to sort, a second click reverses the order.
Steps to follow
- Open Reports, then Answered calls.
- Choose the queue and the period.
- Enter your threshold in SLA (sec), then click Refresh.
- Read the Service level table first: it tells you at which second your callers tip over, independent of what you had decided.
- Compare Avg. wait and Max wait in the by-queue detail. A large gap signals one-off spikes, not a permanent problem.
- Finally, look at By agent and By caller.
If it doesn't work
The Service level table doesn't move when I change the threshold. That's normal: its six thresholds are fixed. Only the SLA tile and the SLA column of the by-queue detail use the value you enter.
By agent and By caller added together don't match the number of answered calls. The two columns count conversation endings in the queue, while Answered counts connections made. A transferred call leaves the queue and doesn't end there: it's counted in Transf. and in neither of the two columns.
The SLA column shows a dash for a queue. No call was answered on this queue during the period. The rate is calculated on answered calls, it doesn't exist when there are none.
The wait times look too short to me. The wait stops at the connection. The ringing at the agent's end isn't included. To see both separately, open the Distribution report and click a slot: the detail shows a Ring column and a Wait column.
The screen shows "No answered calls for this period." The default period starts on the first day of the current month. Widen it, and check the Queue filter before concluding that no call was taken.
What each report measures, and how to read it
See the Queues and statistics page