Agent performance
Activity per person: calls taken, calls rung with no answer, conversation time. To be read in full, never on the first column alone.
At a glance
| Where | Reports, Agent performance |
| What it shows | three counters, a chart of the top fifteen agents, then the detail agent by agent |
| Filters | Queue, From, To. No SLA field on this screen |
| Who appears here | agents who had activity in the queue over the period |
| If the period is empty | "No agents for this period" |
How it works
The report doesn't look at who is a member of the queue, but at what the queue did with each agent over the period. An agent who neither took nor missed a call doesn't appear.
Three events structure the reading:
- the queue connected a call to this agent: Answered column;
- the agent's phone rang without them answering: Unanswered column;
- the agent logged into the queue: Sessions column.
The Pickup rate is the ratio between calls taken and the number of times the phone rang, in other words answered calls set against answered plus unanswered calls.
The name shown comes from the user record that holds the extension number. When no record matches, the number is shown as is.
What the screen shows
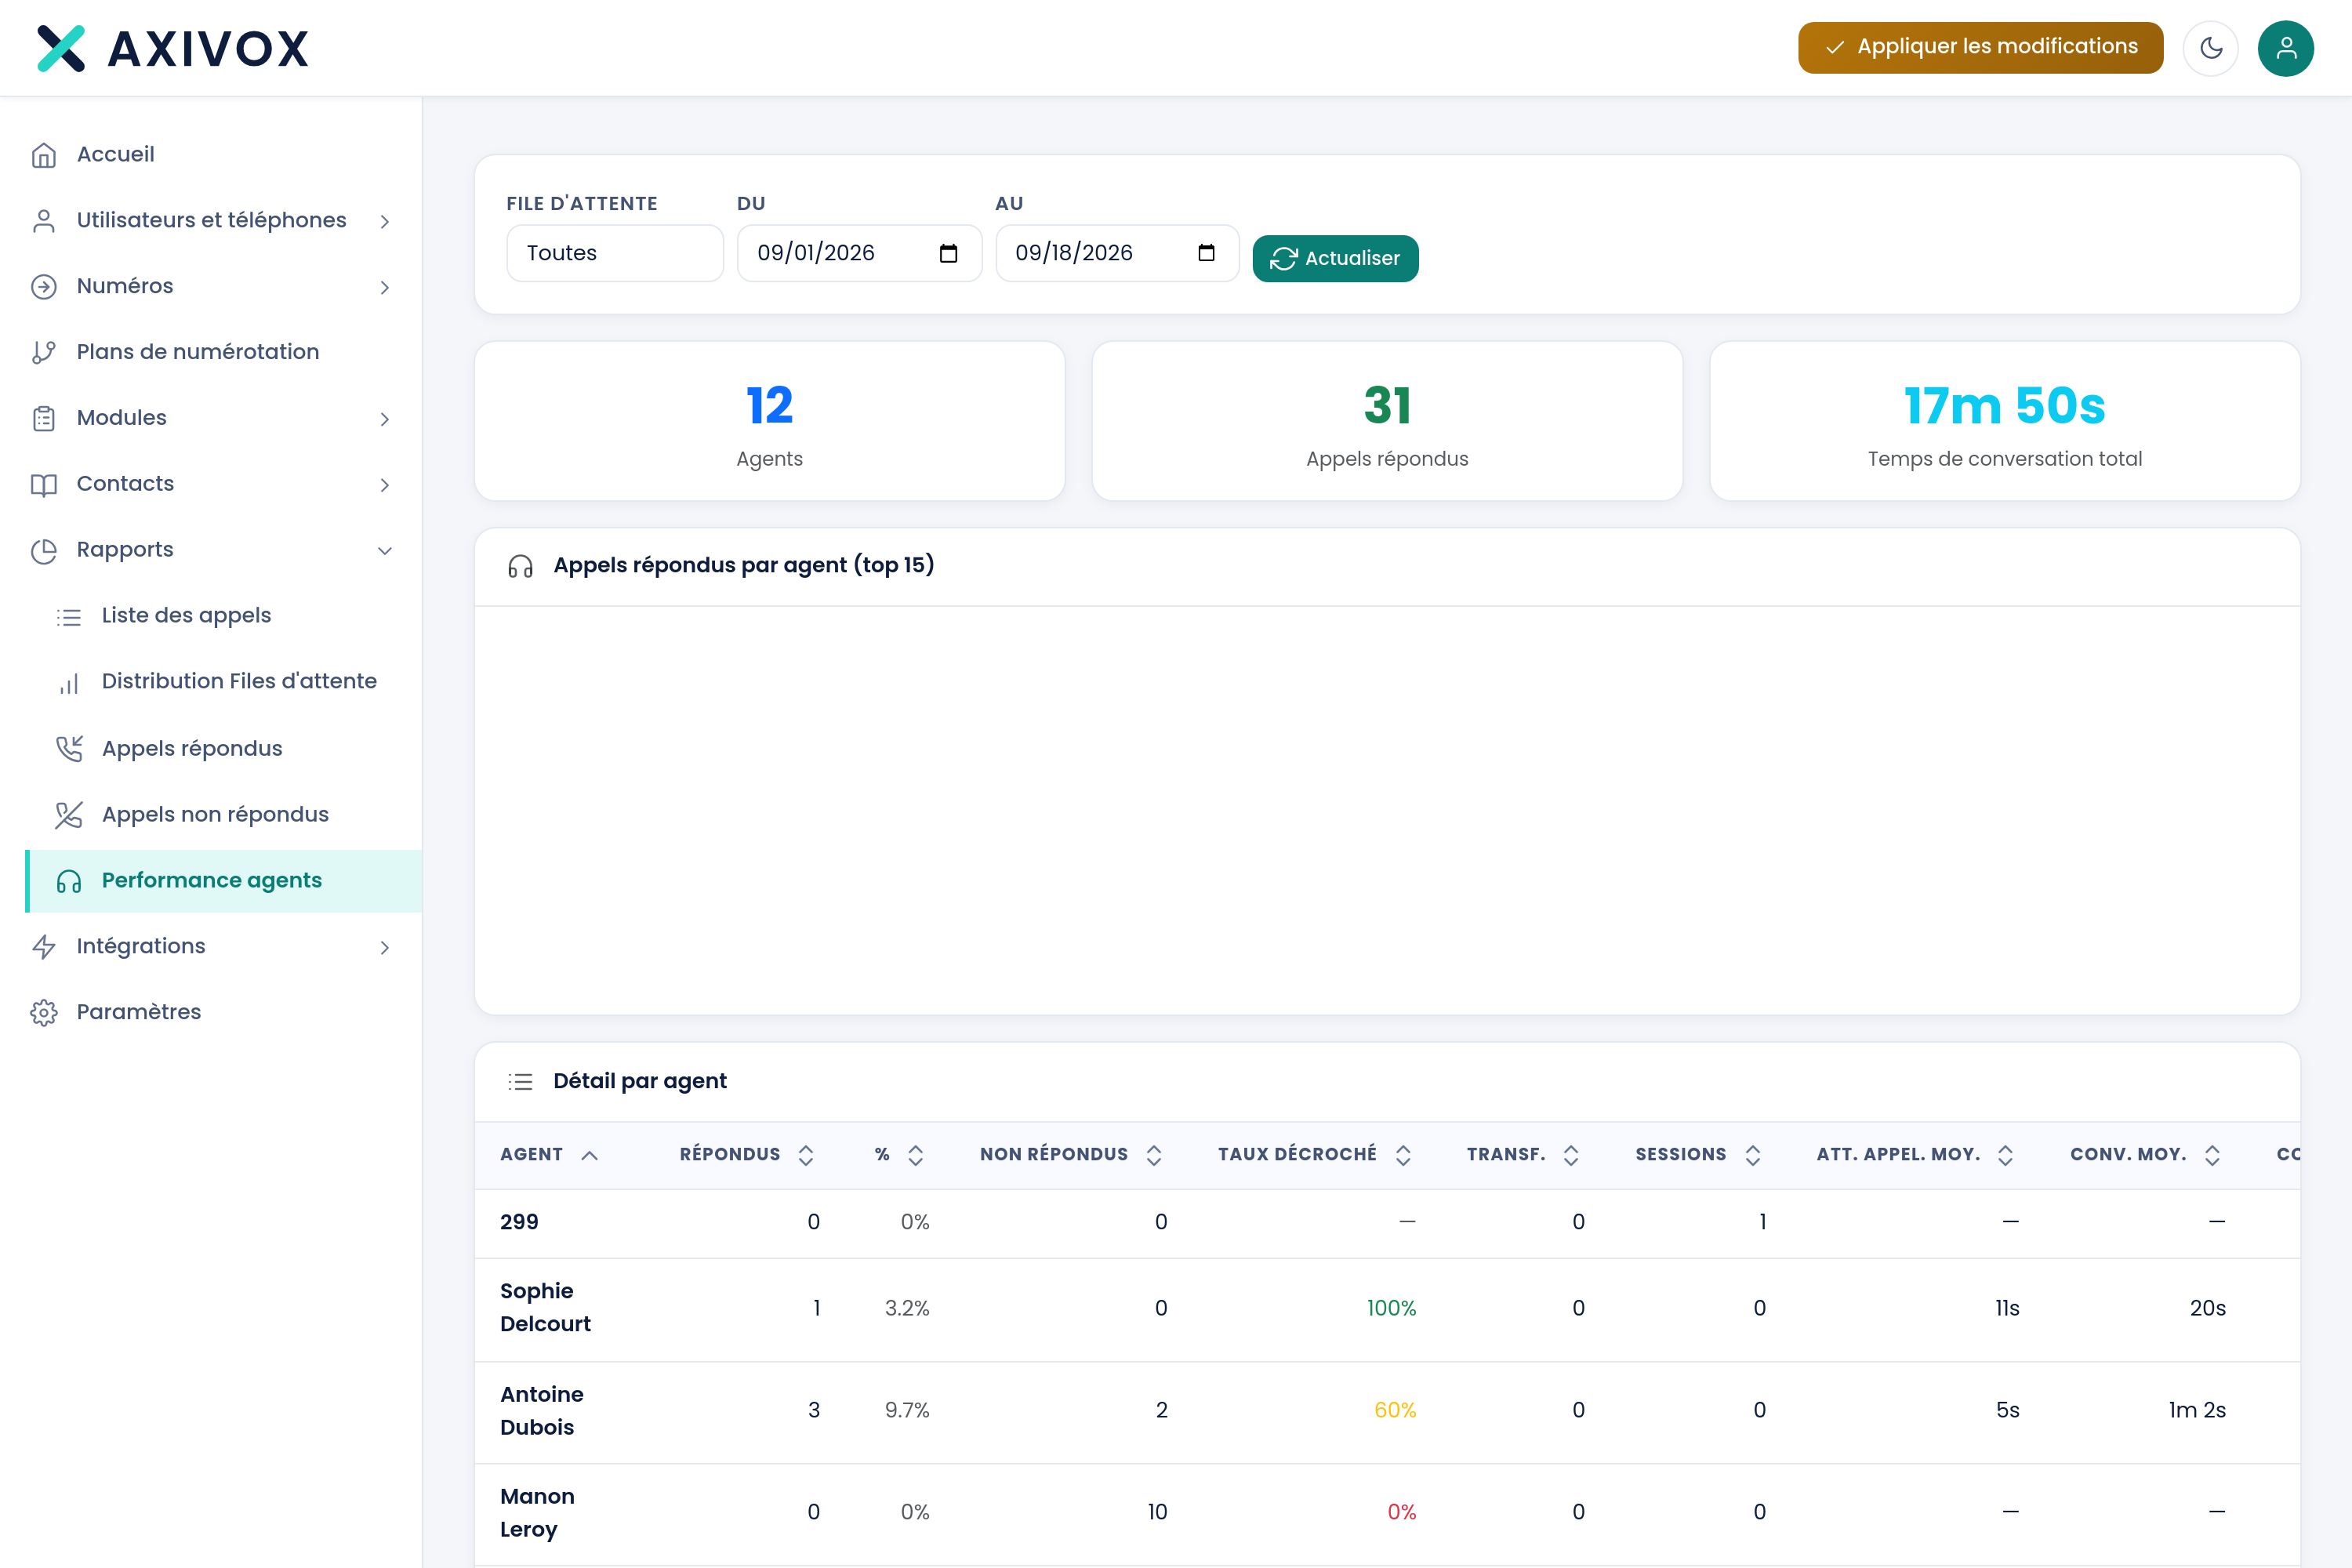
The three tiles at the top: Agents, Answered calls, Total conversation time. Then the Answered calls by agent (top 15) chart, which only shows the top fifteen, and finally the full table.
| Column | What it shows |
|---|---|
| Agent | the extension's name, or its number if no record matches |
| Answered, then % | the calls taken, and their share of the team's total |
| Unanswered | the times the phone rang at this agent with no answer |
| Pickup rate | answered calls set against rings received. A dash means no call rang |
| Transf. | the calls this agent transferred |
| Sessions | the number of times the agent logged into the queue over the period |
| Avg. caller wait | the average wait of callers before being taken by this agent |
| Avg., min, max conv. | the conversation durations |
| Total time | the total time spent in conversation |
Each header can be clicked to sort. Sorting by Unanswered is often more informative than sorting by Answered.
Steps to follow
- Open Reports, then Agent performance.
- Choose the queue and the period, then click Refresh.
- Sort by Pickup rate rather than Answered: it's the column that compares people carrying an unequal load.
- Check the Sessions column before comparing two agents against each other.
- Look at Avg. conv. next to Answered: together they tell the story of the call, not the volume.
- To understand a surprising figure, go back to the Distribution report and open the detail of the slot concerned: it names the agent call by call.
If it doesn't work
An agent who's working doesn't appear in the table. The report only lists agents who had activity in the queue over the period. An agent who was present but received no call doesn't appear, and neither does an agent who answers on an extension instead of through the queue.
An agent appears under their extension number instead of their name. No user record holds this number in your installation, most often because the extension has since been deleted.
The Sessions column is at zero for an agent who answers calls. This is a static agent: a permanent member of the queue who doesn't need to log in. Nothing to fix.
The pickup rate shows a dash. This agent's phone never rang for this queue over the period. The rate isn't zero, it can't be calculated.
The total of answered calls doesn't match the Answered calls report. Both reports count the same connections, but one groups them by agent and the other by queue. Compare over the same period and the same queue before concluding there's a discrepancy.
What each report measures, and how to read it
See the Queues and statistics page