Distribution
When your calls arrive and what becomes of them, hour by hour and day by day. This is the report used to decide on hours and staffing.
At a glance
| Where | Reports, Queue distribution |
| What it shows | four counters, four breakdowns over time, then a table by queue and a table by agent |
| Filters | Queue, From, To, SLA (sec) |
| Detail | each table row opens onto the call list for that slot |
| Time zone | that of your installation, set in Settings |
How it works
A call that enters a queue leaves it in three ways, and only three: an agent takes it, the caller hangs up beforehand, or the call runs out the queue's maximum wait time and goes back into the dial plan. The report counts these three outcomes and sorts them into time slots.
The four breakdowns are the same figures seen from four angles:
- by hour of the day: your peak hours;
- by day of the week: the busiest day;
- by day of the month: start- or end-of-month effects;
- by calendar day: how things change over time.
A slot with no calls at all isn't shown. A table that jumps from 9am to 11am means no call entered the queue at 10am over the chosen period.
What the screen shows
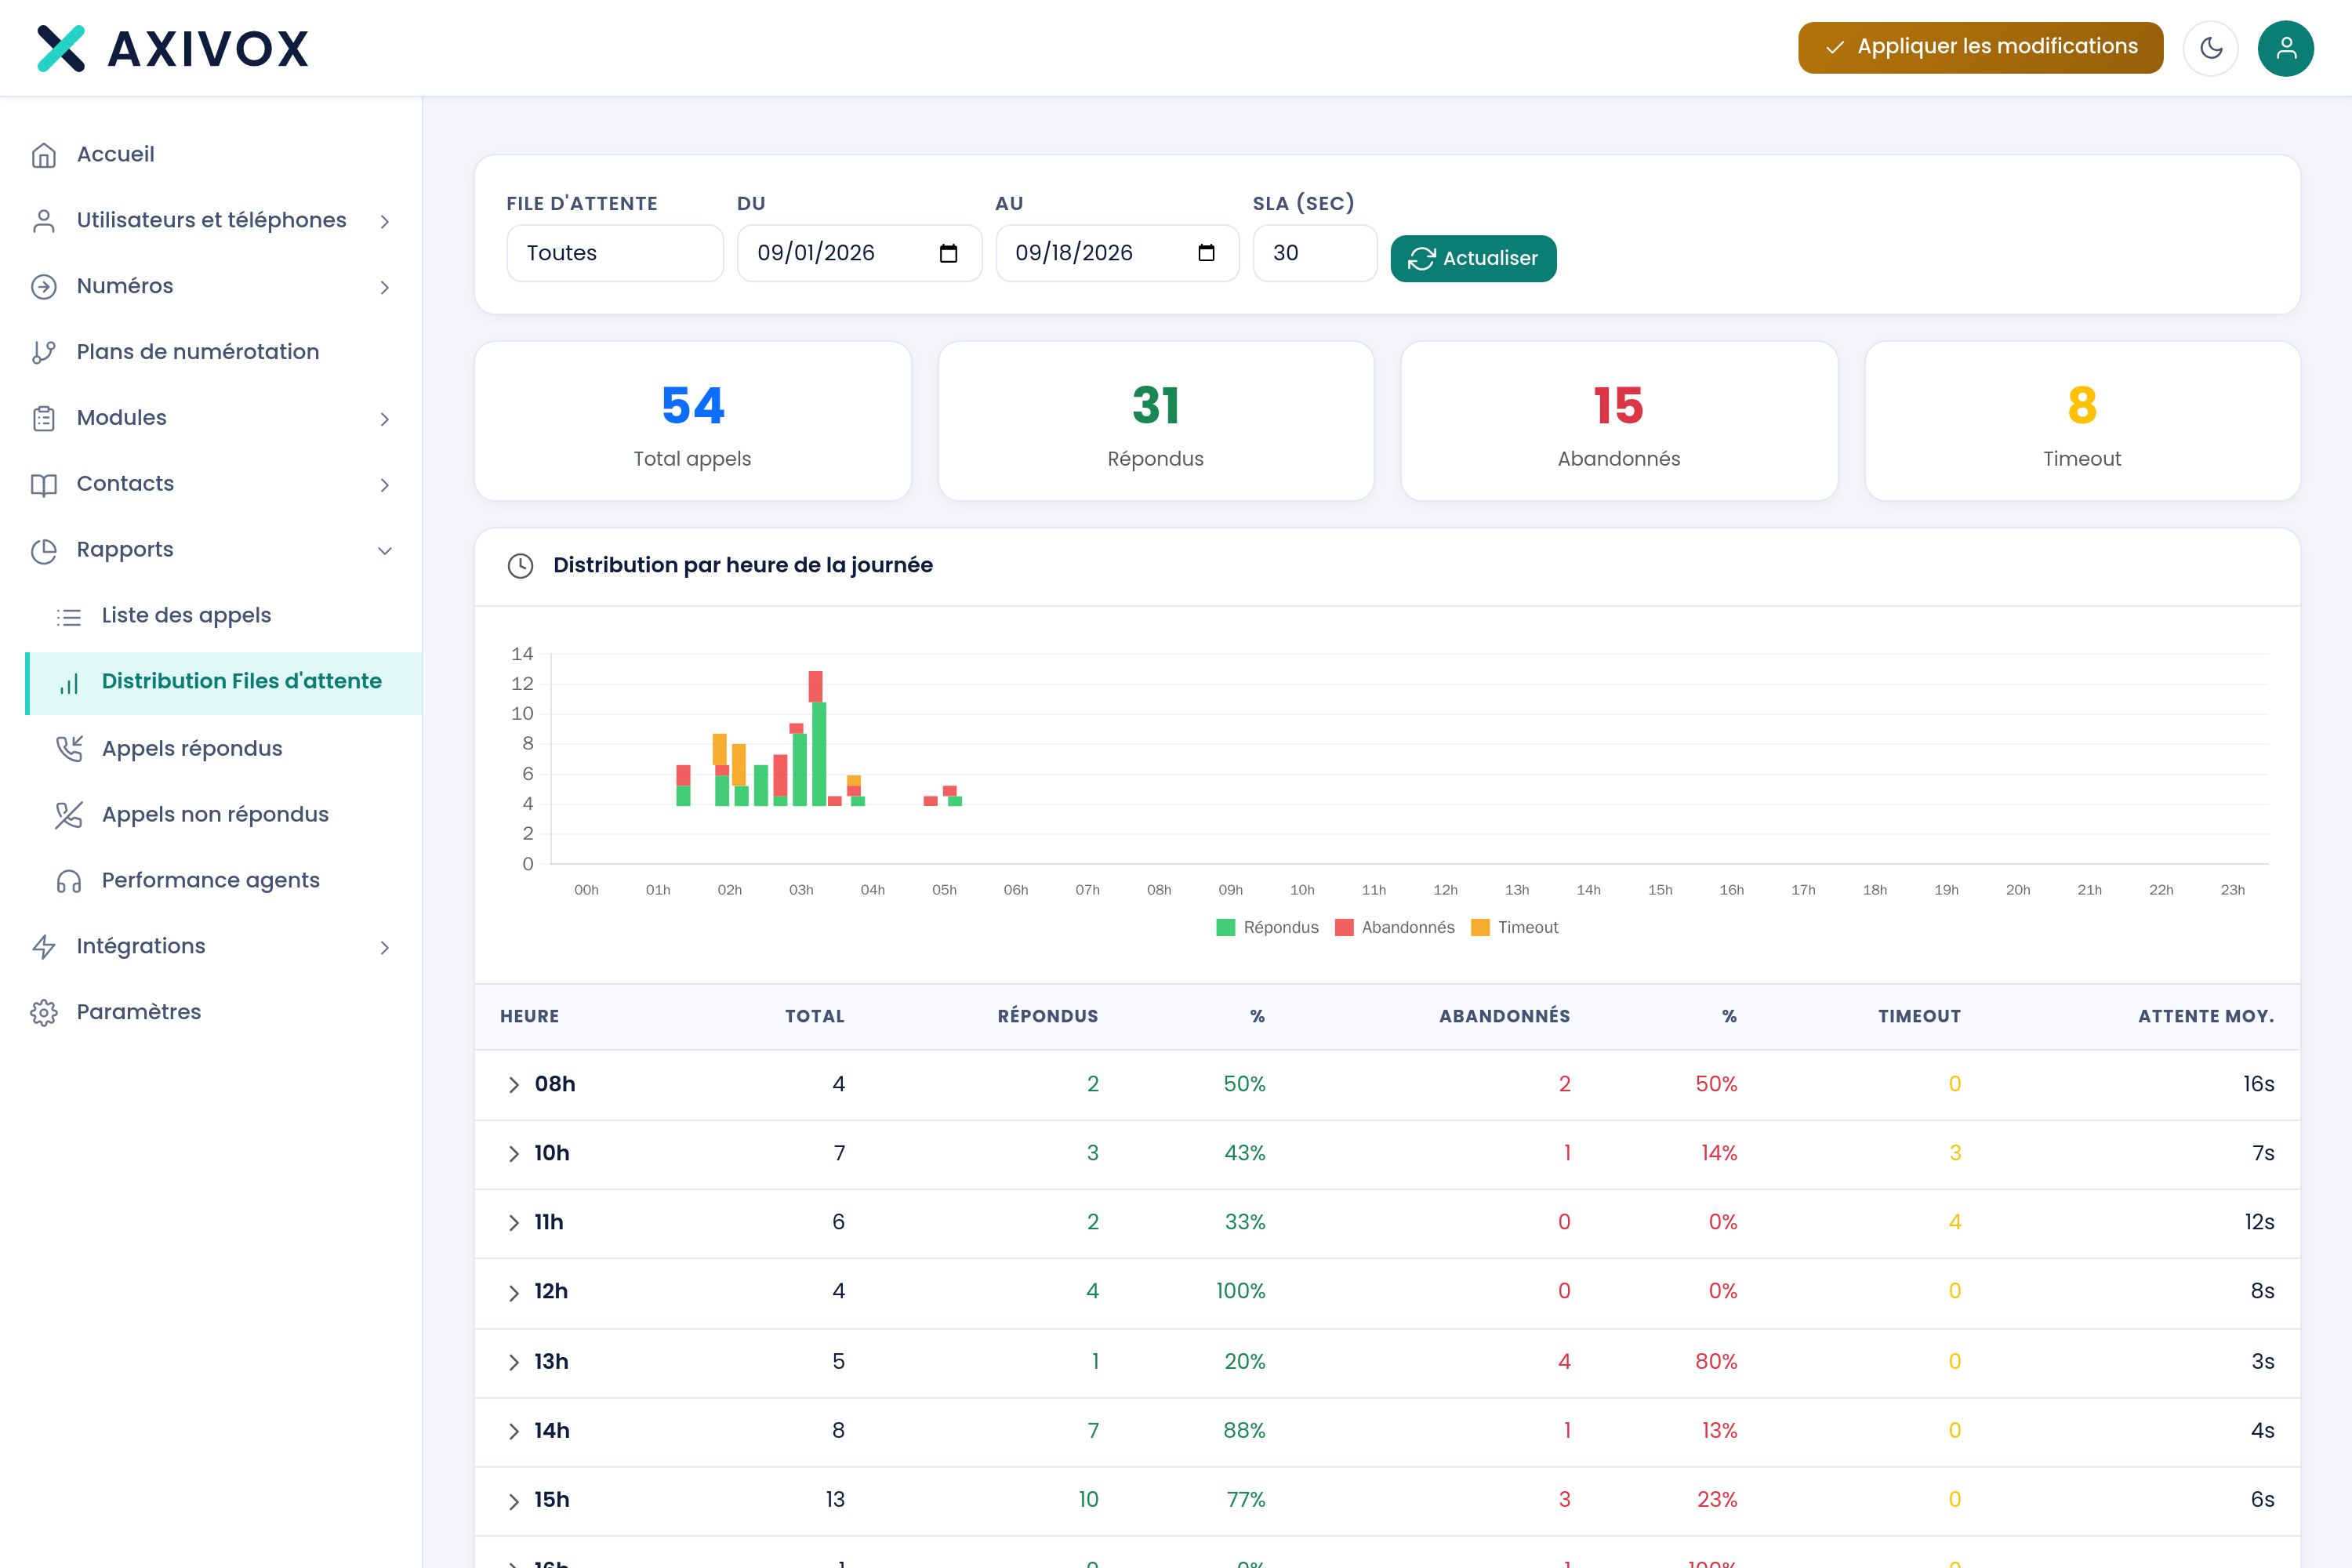
The four counters at the top:
| Counter | What it counts |
|---|---|
| Total calls | the sum of the three below |
| Answered | the calls an agent took |
| Abandoned | the calls where the caller hung up while waiting |
| Timeout | the calls that ran out the maximum wait time and left the queue |
Below each chart, the same table:
| Column | What it shows |
|---|---|
| Hour, Day or Date | the slot concerned |
| Total | all calls in the slot |
| Answered, then % | the calls taken, and their share of the slot |
| Abandoned, then % | the calls hung up while waiting, and their share |
| Timeout | the calls that left through the maximum wait time |
| Avg. wait | the average wait before connection, on answered calls only |
Then Statistics by queue:
| Column | What it shows |
|---|---|
| Queue | the queue's name |
| Inbound | the calls that entered the queue |
| Answered, Abandoned | the two main outcomes |
| Answer rate | Answered divided by Inbound |
| SLA | the share of answered calls under the SLA (sec) threshold. A dash means no call was answered |
| Avg. wait | the wait before connection |
| Avg. duration | the conversation duration |
And finally Statistics by agent: Agent, Queue, Answered, Unanswered, Transfers, Avg. duration, Total time. Each header of these two tables can be clicked to sort.
Steps to follow
- Open Reports, then Queue distribution.
- Choose the queue, the period, and the SLA (sec) threshold.
- Click Refresh.
- Start with the by hour of the day breakdown: it's the one that pays off fastest.
- Spot the slot where the Abandoned column rises, then compare it to your staffing at that hour.
- Click that slot's row: the list of its calls opens, with the agent, date, number, event, ring, wait and conversation.
- Do the same reading again on the previous period, to tell a lasting spike from a one-off.
If it doesn't work
Peak hours fall off from reality. Check the time zone in Settings. Time slots are calculated at the time of your installation, not that of your browser.
An hour or a day is missing from the table. Slots with no calls aren't shown. If a whole day is missing even though you were working, check the period first, then the Queue filter.
The SLA column shows a dash. No call was answered on this queue during the period. The rate isn't zero, it doesn't exist: it's calculated on answered calls.
The percentage of answered calls looks too low. Look at the Timeout column before drawing conclusions. A call that exited by timeout isn't a lost call: it carried on in your dial plan, towards another extension or voicemail. It's the Abandoned column that measures what you're really losing.
An agent appears under their extension number. The name comes from the user record that holds this number. A since-deleted extension is shown under its number.
What each report measures, and how to read it
See the Queues and statistics page